We have evaluated the performance of our method ultragsea using two available benchmark tools for enrichment algorithms: 1. GSEABenchmarkeR and 2. EAbenchmark.
GSEABenchmarkeR
The GSEABenchmarkeR package (BioC, github) implements an extendable framework for reproducible evaluation of enrichment methods of gene expression data. It includes a comprehensive real data compendia (microarray and RNA-seq) of test datasets. Methods can then be assessed with respect to runtime, statistical significance, and relevance of the results for the phenotypes investigated.
GSEABenchmarkeR measures the ‘relevance’ of an algorithm by comparing the significantly detected gene sets against a list of ‘validated genesets’ in a collection of reference datasets. Somehow this is a measure of the true positive rate (TPR). Benchmarking was conducted on 42 GEO data sets and a total of 12498 gene sets (GO and KEGG collections). We ran the following methods through the benchmark:
- UltraC: ultragsea with correlation test.
- UltraZ: ultragsea with z-test.
- fastFET: a fast implementation of Fisher Exact test (from the
corpora R package) based on the hypergeometric function
phyper. - GOAT: see corresponding R package.
- cameraPR: preranked camera from the limma R package.
- fGSEA: fast GSEA from the
fgseaR package - Plaid: a single-sample enrichment followed by a t-test.
- dual: combination of Plaid and ultraC.
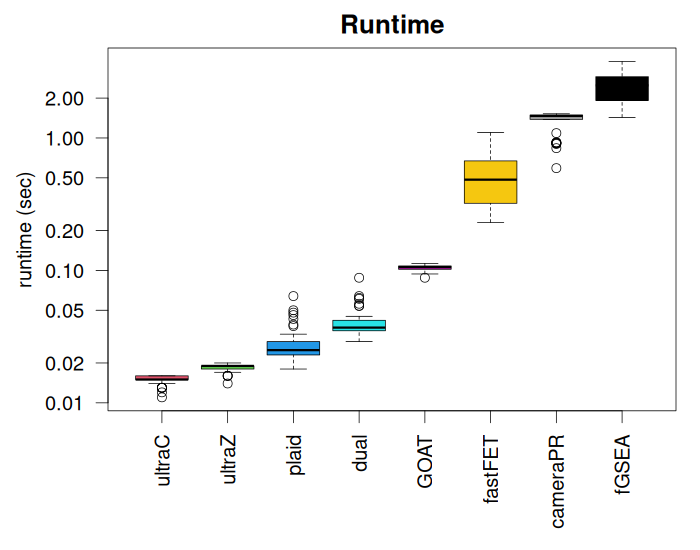
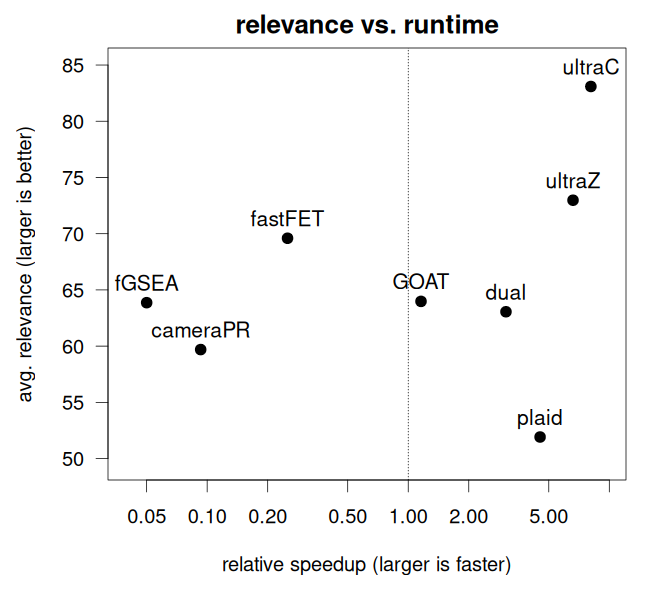
From Figure 1 we see that ultragsea methods (ultraC and ultraZ) are the fastest, about 100 faster than fGSEA. Figure 2 shows that ultraC also achieves the highest relevance compared to the others.
EAbenchmark
The EAbenchmark R package, presents a generalized benchmark for evaluating enrichment analysis (EA) methods, utilizing a diverse set of 82 gene expression datasets across 26 diseases, with a balanced representation of non-cancer conditions. EAbenchmark introduces the Disease Pathway Network, which links related KEGG pathways for evaluation, enabling assessment of the TPR/FPR of EA methods.
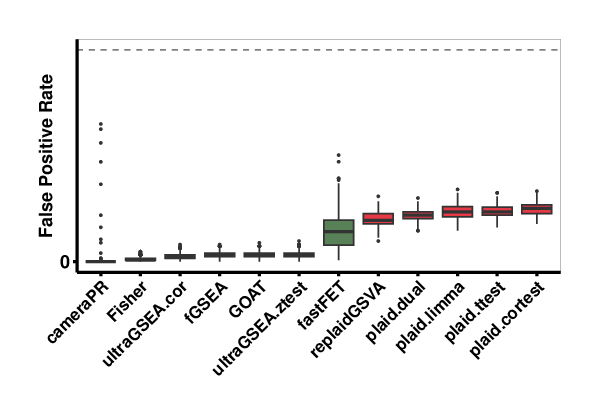
EAbenchmark evaluates the false positive rate (FPR) performance of the EA methods on randomized data (see Figure 3). An ideal method would not report any significantly enriched gene sets.
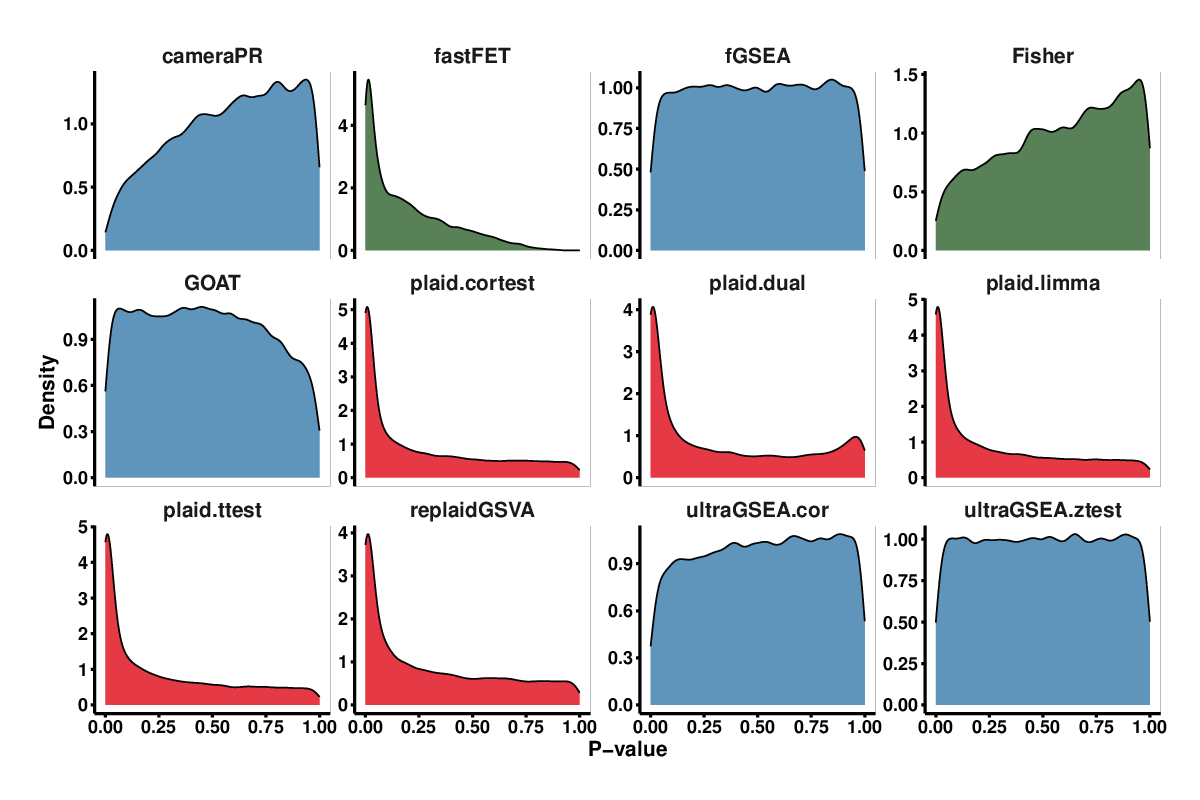
Figure 4 plots the distribution of p-values of the methods under the null hypothesis. Enrichment analysis methods should produce P-values that are uniformly distributed but in practice they are either biased toward 0 or 1 or exhibit a bimodal distribution biased toward both extremes. Such a bias can affect the significance of the analysis, hence we examined the distribution of P-values for each method to see if it was right- or left-skewed. A right-skewed distribution (P-values biased toward 0) can potentially lead to false positives by reporting pathways as impacted when they are not. Conversely, a left-skewed distribution (P-values biased toward 1) can lead to false negatives by reporting pathways as not significant when they are actually impacted.
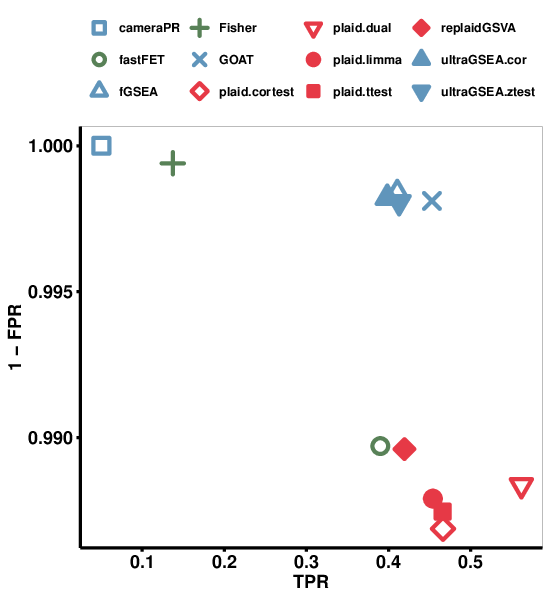
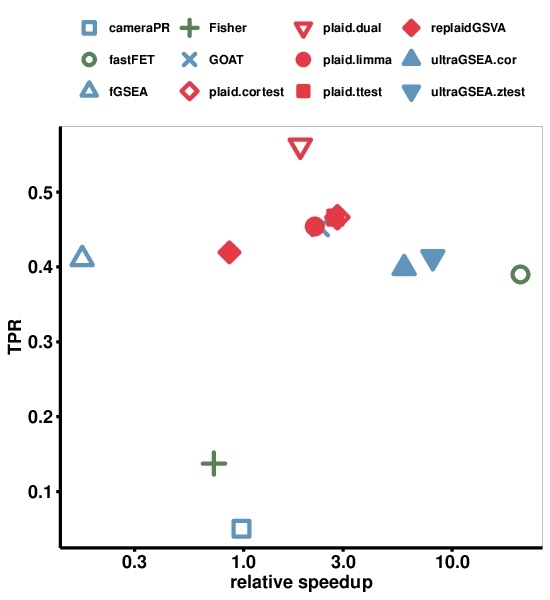
By plotting true positive rate (TPR) against FPR we can visually determine the method with highest TPR and lowest FPR (Figure 5). We see that GOAT performs the best with similar low FPR but slightly higher TPR than fGSEA, and the ultraGSEA methods. fastFET and the single-sample enrichment methods (PLAID and replaidGSVA) had similar TPR but higher FPR (although still very small, well below 2%).
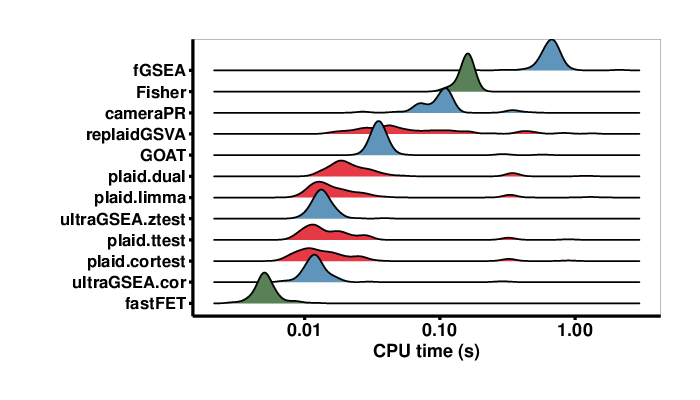
Finally, Figure 6 shows the runtimes of the methods. The ultragsea methods are almost 100x faster than fGSEA and about 10x faster than cameraPR and the naively implemented ORA Fisher’s exact test (Fisher). PLAID, our single-sample enrichment method, is still very fast. The ultragsea methods (ultraGSEA.cor and ultraGSEA.ztest) and fastFET (hypergeometric-base Fisher’s Exact test) are the fastest.